Building on the groundwork laid in Stage 1, this phase applied Canonical Correlation Analysis (CCA) to link global sea surface temperature (SST), cloud cover, and sea ice concentration (SIC). CCA is a multivariate statistical technique designed to uncover patterns that co-vary most strongly between two climate fields — in this case, SST and TCC or SST and SIC. This allows us to identify the climate modes that drive changes in clouds and sea ice and to quantify the relative influence of anthropogenic and natural drivers.
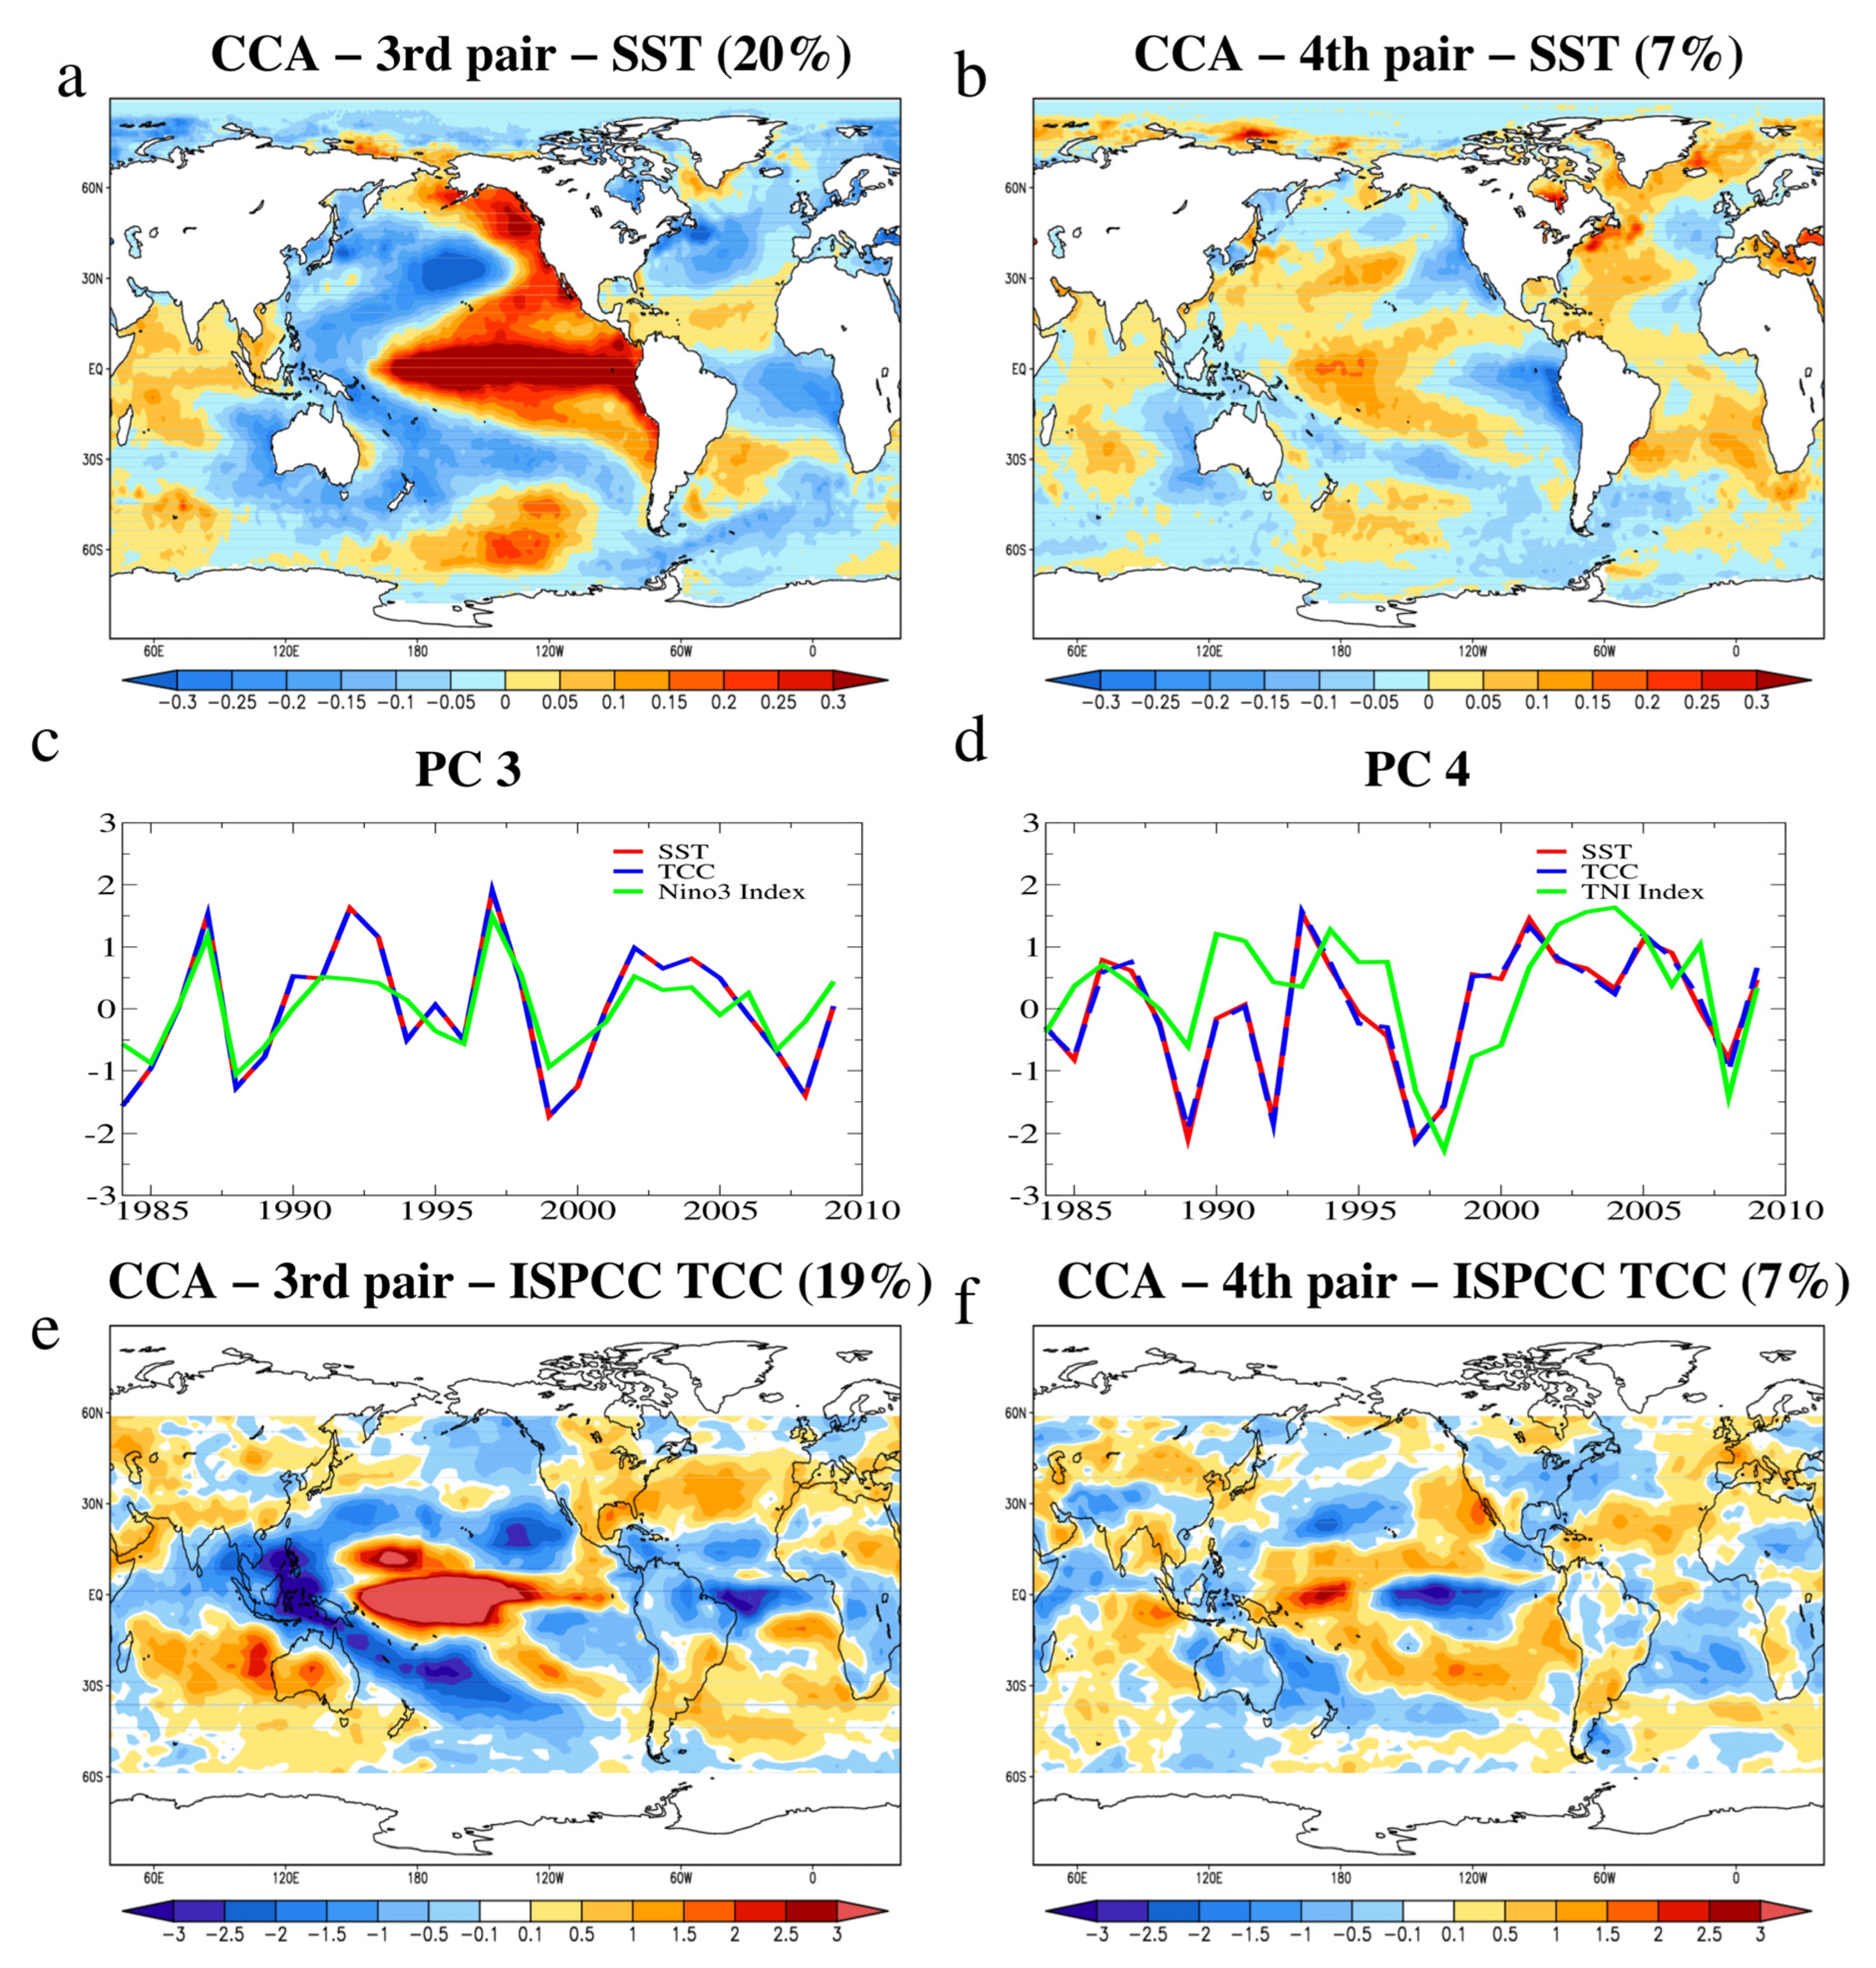
This analysis revealed that much of the global cloud variability is tied to Pacific climate modes, particularly the El Niño–Southern Oscillation (ENSO).
The third CCA pair corresponds to the Eastern Pacific (EP) ENSO, showing warm SST anomalies in the eastern equatorial Pacific and increased cloudiness over the same region and the Atlantic. The fourth CCA pair captures the Central Pacific (CP) ENSO, marked by a V-shaped SST pattern in the central Pacific and cloud anomalies consistent with a shift in tropical convection. Together, these results confirm that global cloud patterns are strongly modulated by ENSO phases, with direct impacts on global radiation balance.
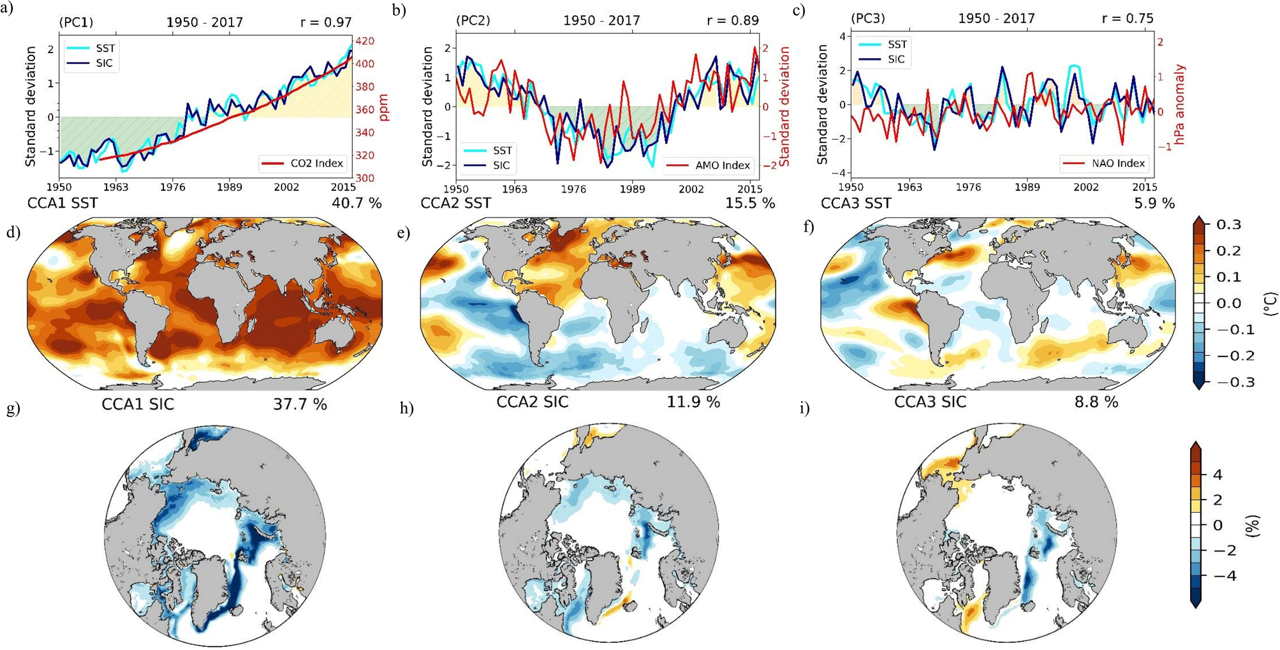
This analysis revealed three dominant SST–SIC relationships that shape Arctic sea ice variability:
These patterns demonstrate that while anthropogenic warming is the primary driver of Arctic sea ice decline, natural climate oscillations continue to modulate regional sea ice behavior.
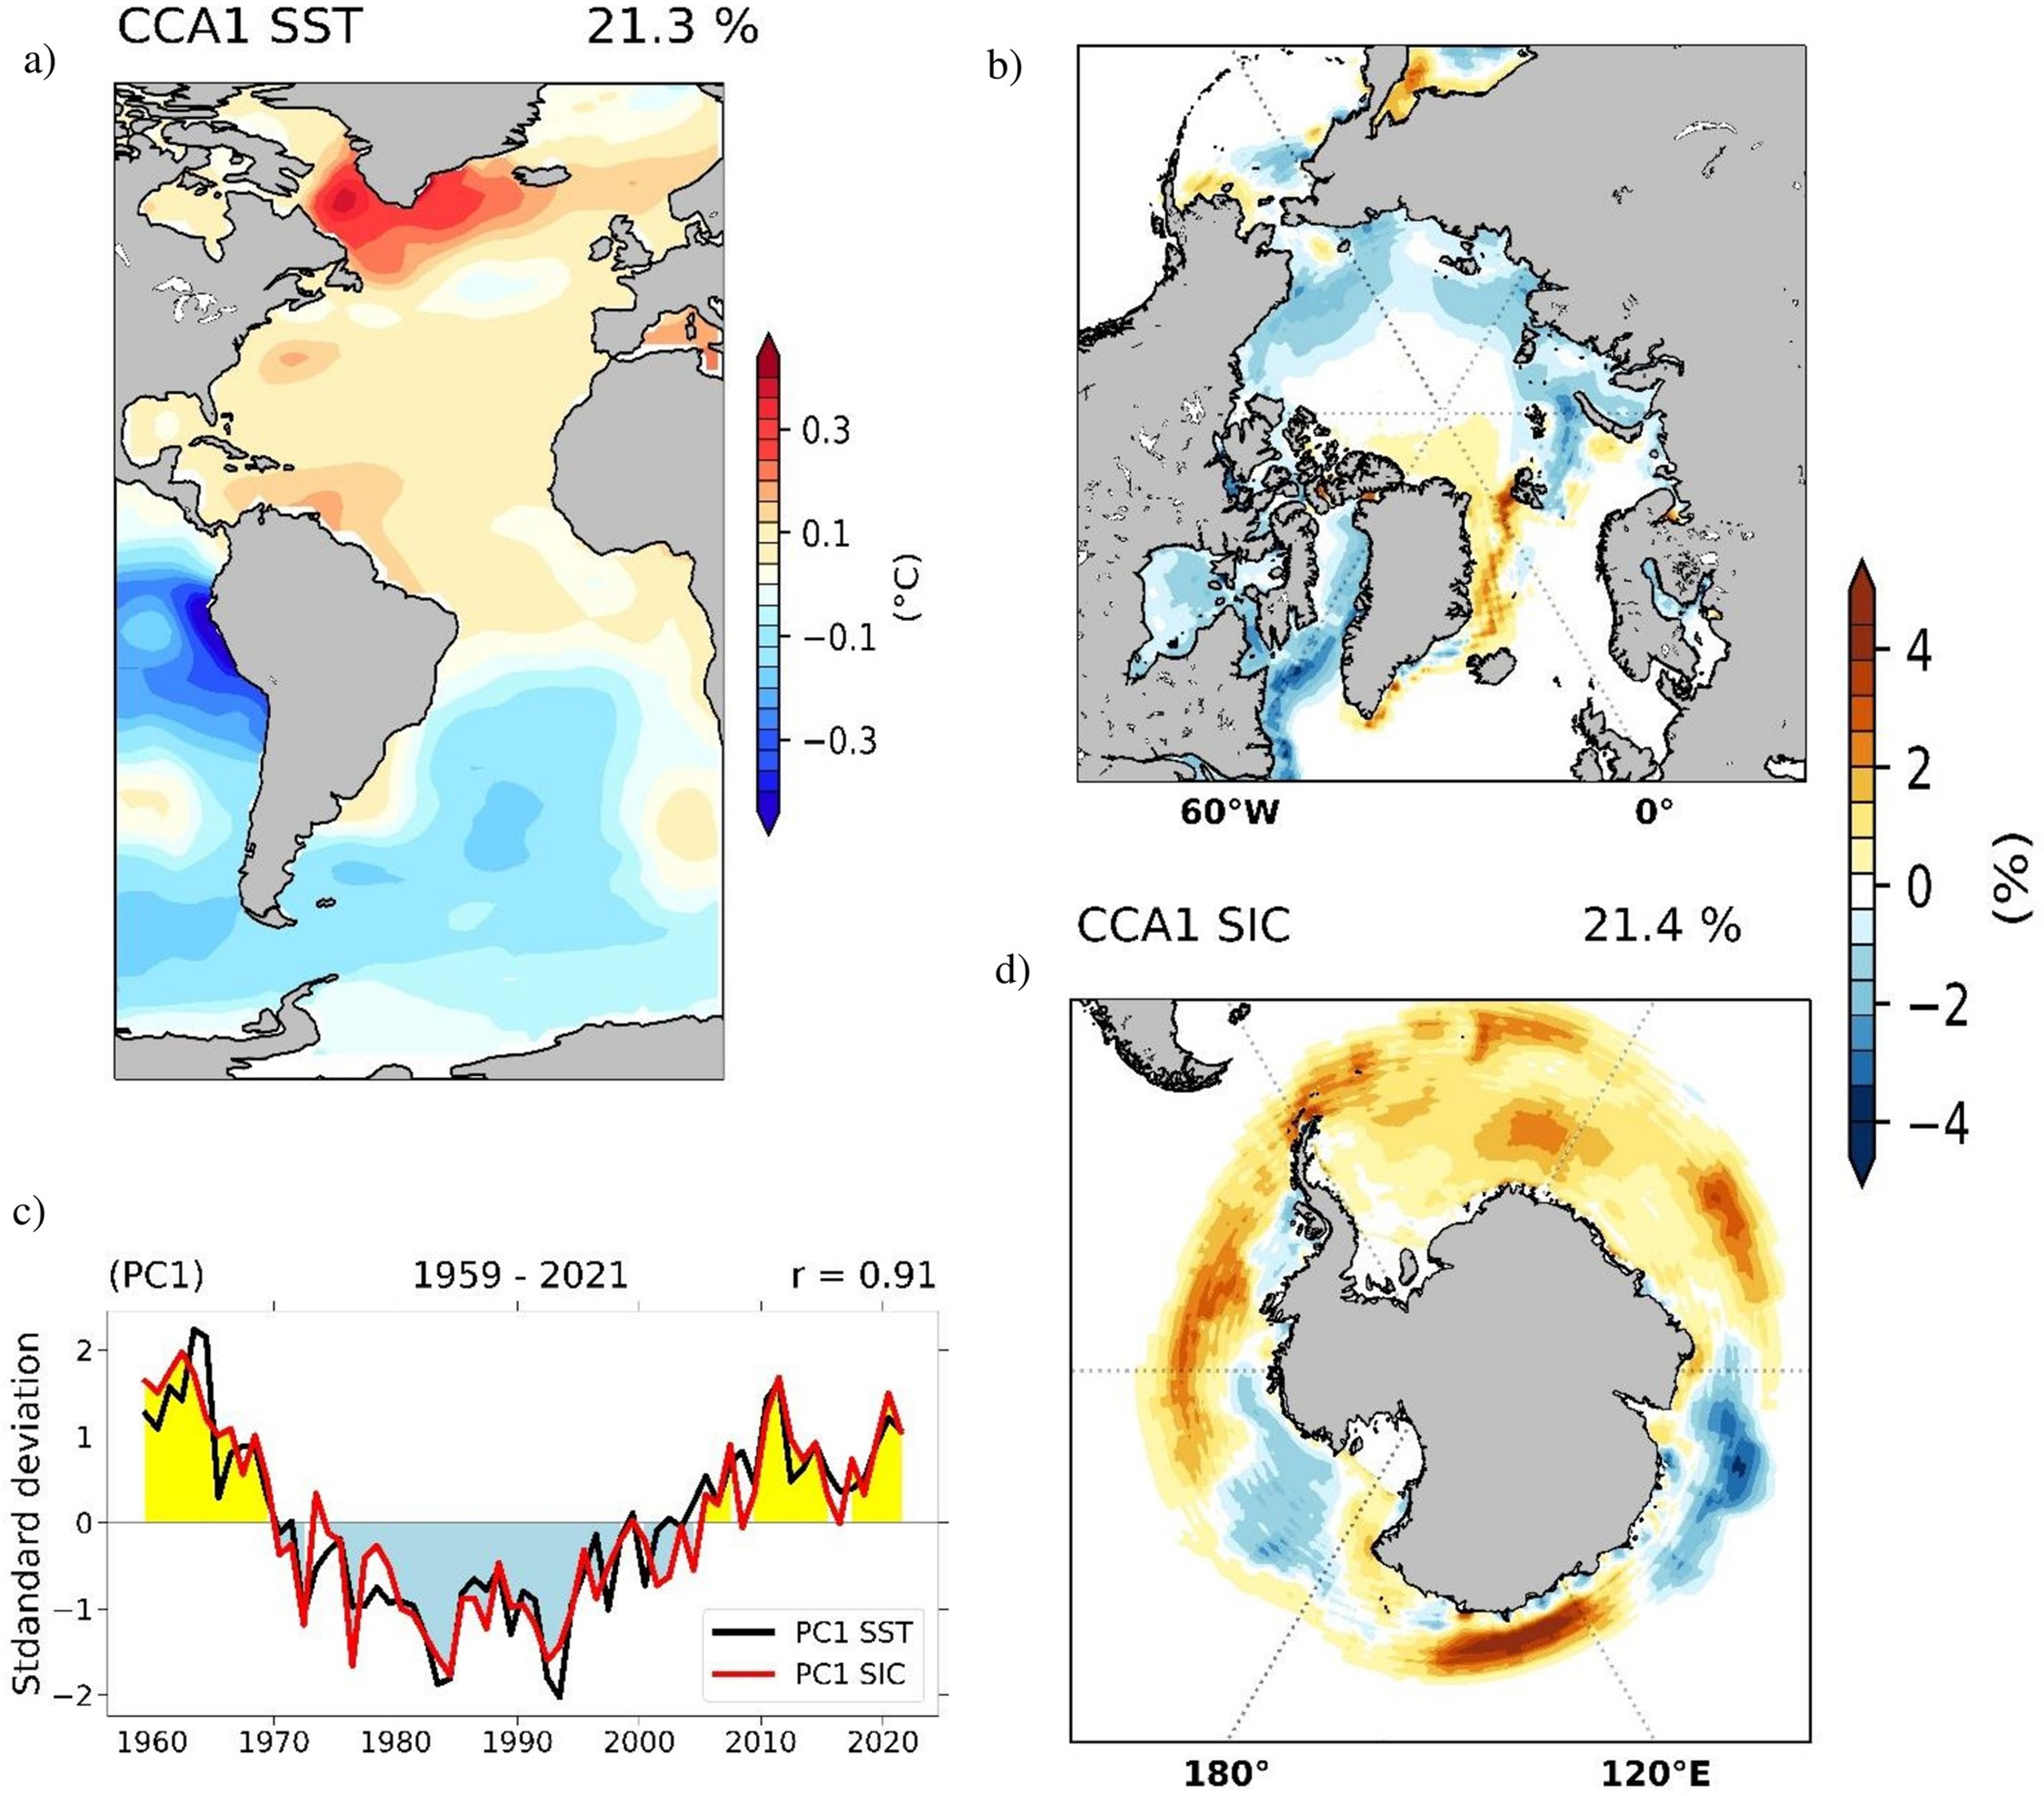
Using long-term reanalysis data, we further identified a multi-decadal connection between the Atlantic Ocean circulation (AMOC) and global sea ice variability.
When the AMOC is strong, the North Atlantic warms, Arctic sea ice declines, and Antarctic sea ice slightly expands — illustrating an inter-hemispheric “seesaw.” These results underscore the importance of natural oceanic variability in shaping polar climate trends, even in the presence of strong anthropogenic forcing.
Together, these findings from Stage 2 provide a comprehensive view of how human activities and natural variability interact to shape clouds and sea ice on a global scale.