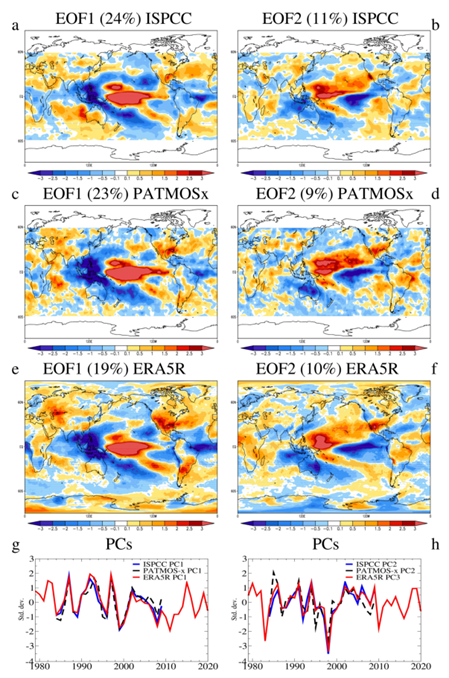
Figure R1. Global modes of TCC variability (Vaideanu et al. 2023a, source link). Left: spatial structures of EOF1 and EOF2/EOF3 from ISCCP, PATMOS-x, and ERA5 datasets. Right: associated principal component time series.
Stage 1 focused on the careful preparation and diagnosis of all datasets used in the project, including observational records, reanalysis products, and climate model simulations. To characterize the dominant patterns of variability in both total cloud cover (TCC) and sea-ice concentration (SIC), we applied Empirical Orthogonal Function (EOF) analysis, a powerful statistical tool widely used in climate science.
The EOF method (Lorenz, 1951) transforms correlated variables into a new set of uncorrelated variables (principal components) that optimally explain variability in the data.
EOF analysis allows us to extract the leading spatial and temporal variability patterns, increasing the signal-to-noise ratio and providing a compact representation of the data.
The first two modes of TCC variability were derived from annual cloud anomalies in ISCCP, PATMOS-x, and ERA5 datasets (Figure R1).
Both modes are dominated by interannual variability. The first two modes explain about 35% (ISCCP) and 32% (PATMOS-x) of total variance, while remaining variability is spread across many small-scale modes likely dominated by noise.
Figure R1. Global modes of TCC variability (Vaideanu et al. 2023a, source link). Left: spatial structures of EOF1 and EOF2/EOF3 from ISCCP, PATMOS-x, and ERA5 datasets. Right: associated principal component time series.
The leading mode of Arctic SIC variability (EOF1) accounts for ~34% of the total variance (Figure R2).
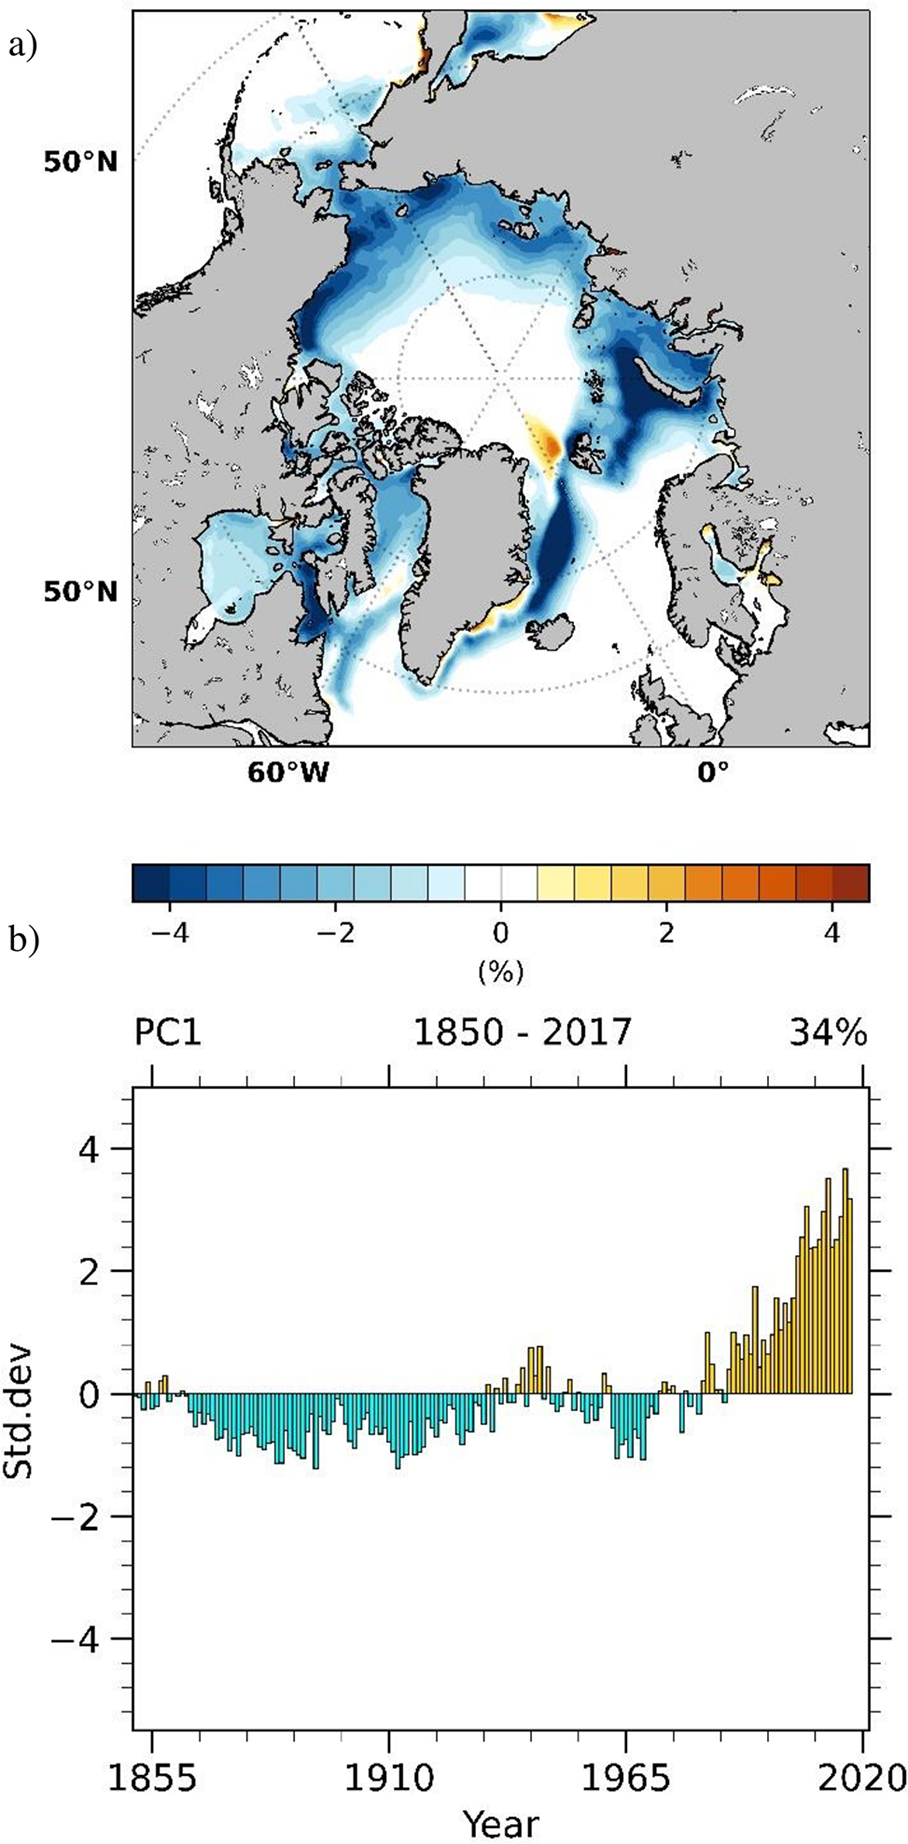
Figure R2. Dominant mode of Arctic SIC variability identified from annual NSIDC anomalies (Vaideanu et al. 2023b, source link). Panel (a): spatial pattern of EOF1 (34% variance explained). Panel (b): associated time series.
EOF analysis from Stage 1 thus provided a robust baseline of the dominant modes of global cloud and sea-ice variability, which were used as a foundation for the analyses in Stage 2.